

Berkshire Hathaway's Q2 2023 Results
Berkshire Hathaway's Q2 2023 Results
Thoughts on second quarter results with a focus on GEICO, BNSF, HomeServices, Clayton Homes, Apple, and repurchases.

Dear Readers,
This article was published for paid subscribers on August 6, 2023. Since I am removing paywalls after six months, it is now free to read. To receive all new premium content as soon as it is published, including coverage of Berkshire Hathaway’s upcoming annual report, please consider a paid subscription.
Thanks for reading!
Overview
Berkshire Hathaway reported net income of $35.9 billion for the second quarter of 2023, a sharp increase from a net loss of $43.6 billion for the second quarter of 2022. However, Berkshire’s net income is a distorted measure of the company’s results. Accounting rules require unrealized gains and losses in Berkshire’s portfolio of equity securities to be included in net income. Due to the large size of the equity portfolio, the effect of quarterly unrealized gains and losses can dominate swings in net income.
To provide figures more reflective of underlying business results, Berkshire reported after-tax operating earnings of $10 billion for the second quarter of 2023, up from $9.4 billion for the second quarter of 2022. Operating earnings for the first half of 2023 came in at $18.1 billion compared to $16.6 billion for the first half of 2022.
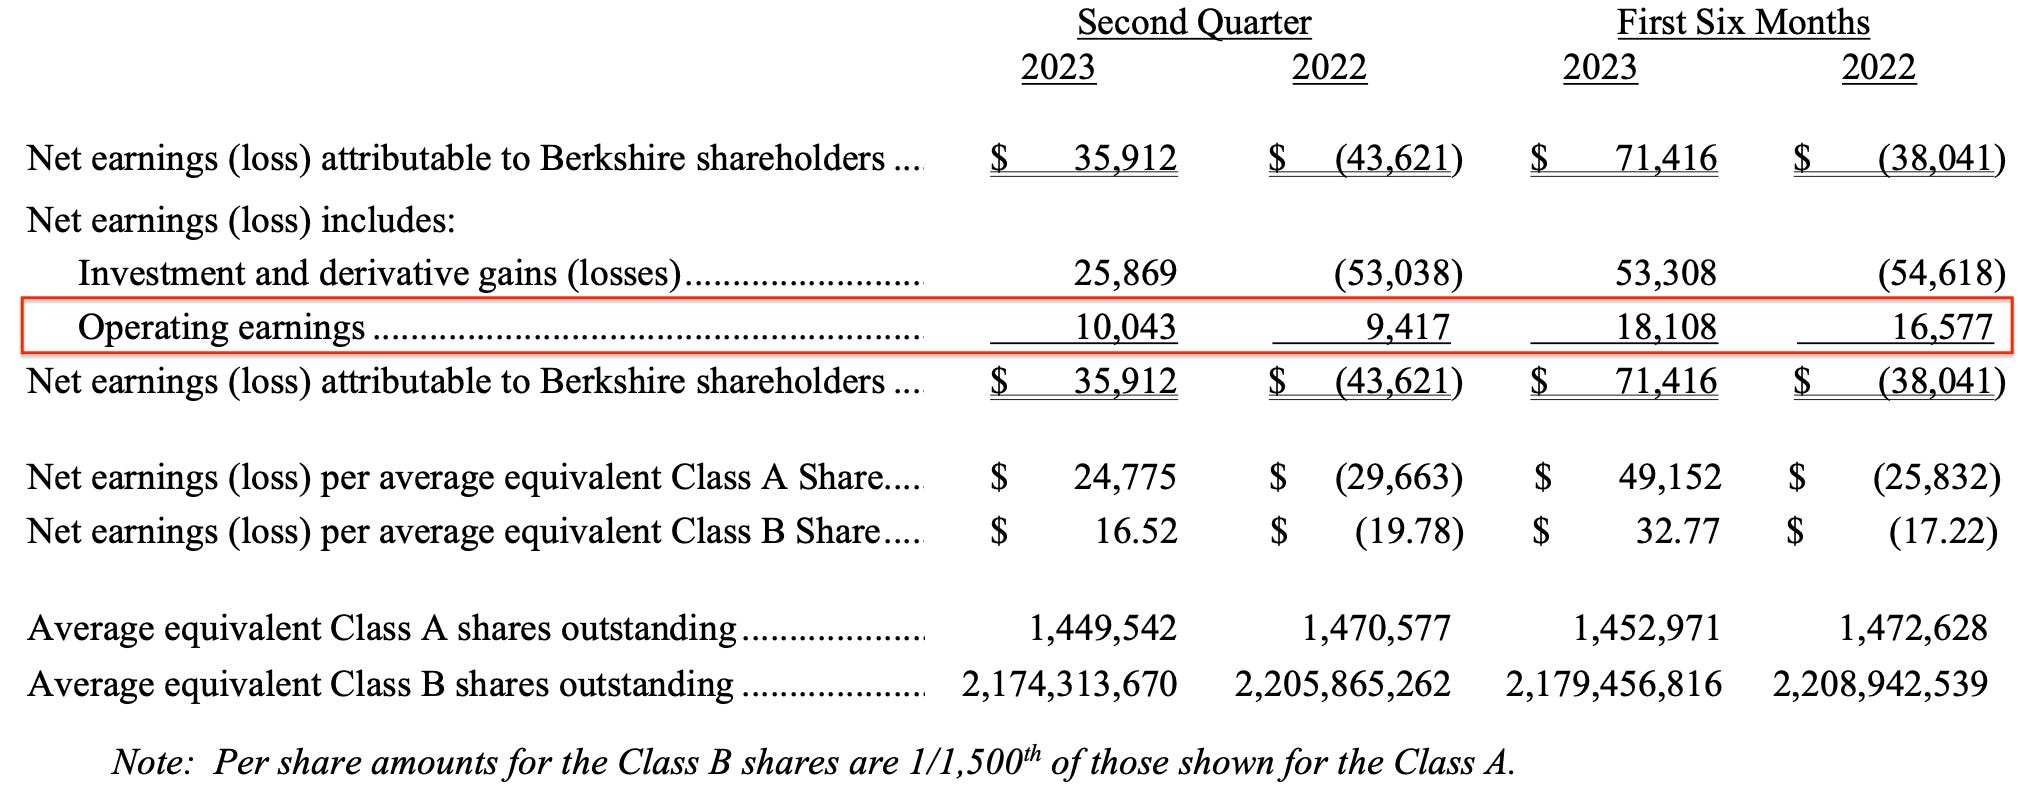
Berkshire provides a useful breakdown of after-tax operating earnings in the press release allowing shareholders to understand the sources of earnings at a very high level. Although the press release is insufficient for a complete understanding of Berkshire’s results, we can spot major trends by examining the following table.
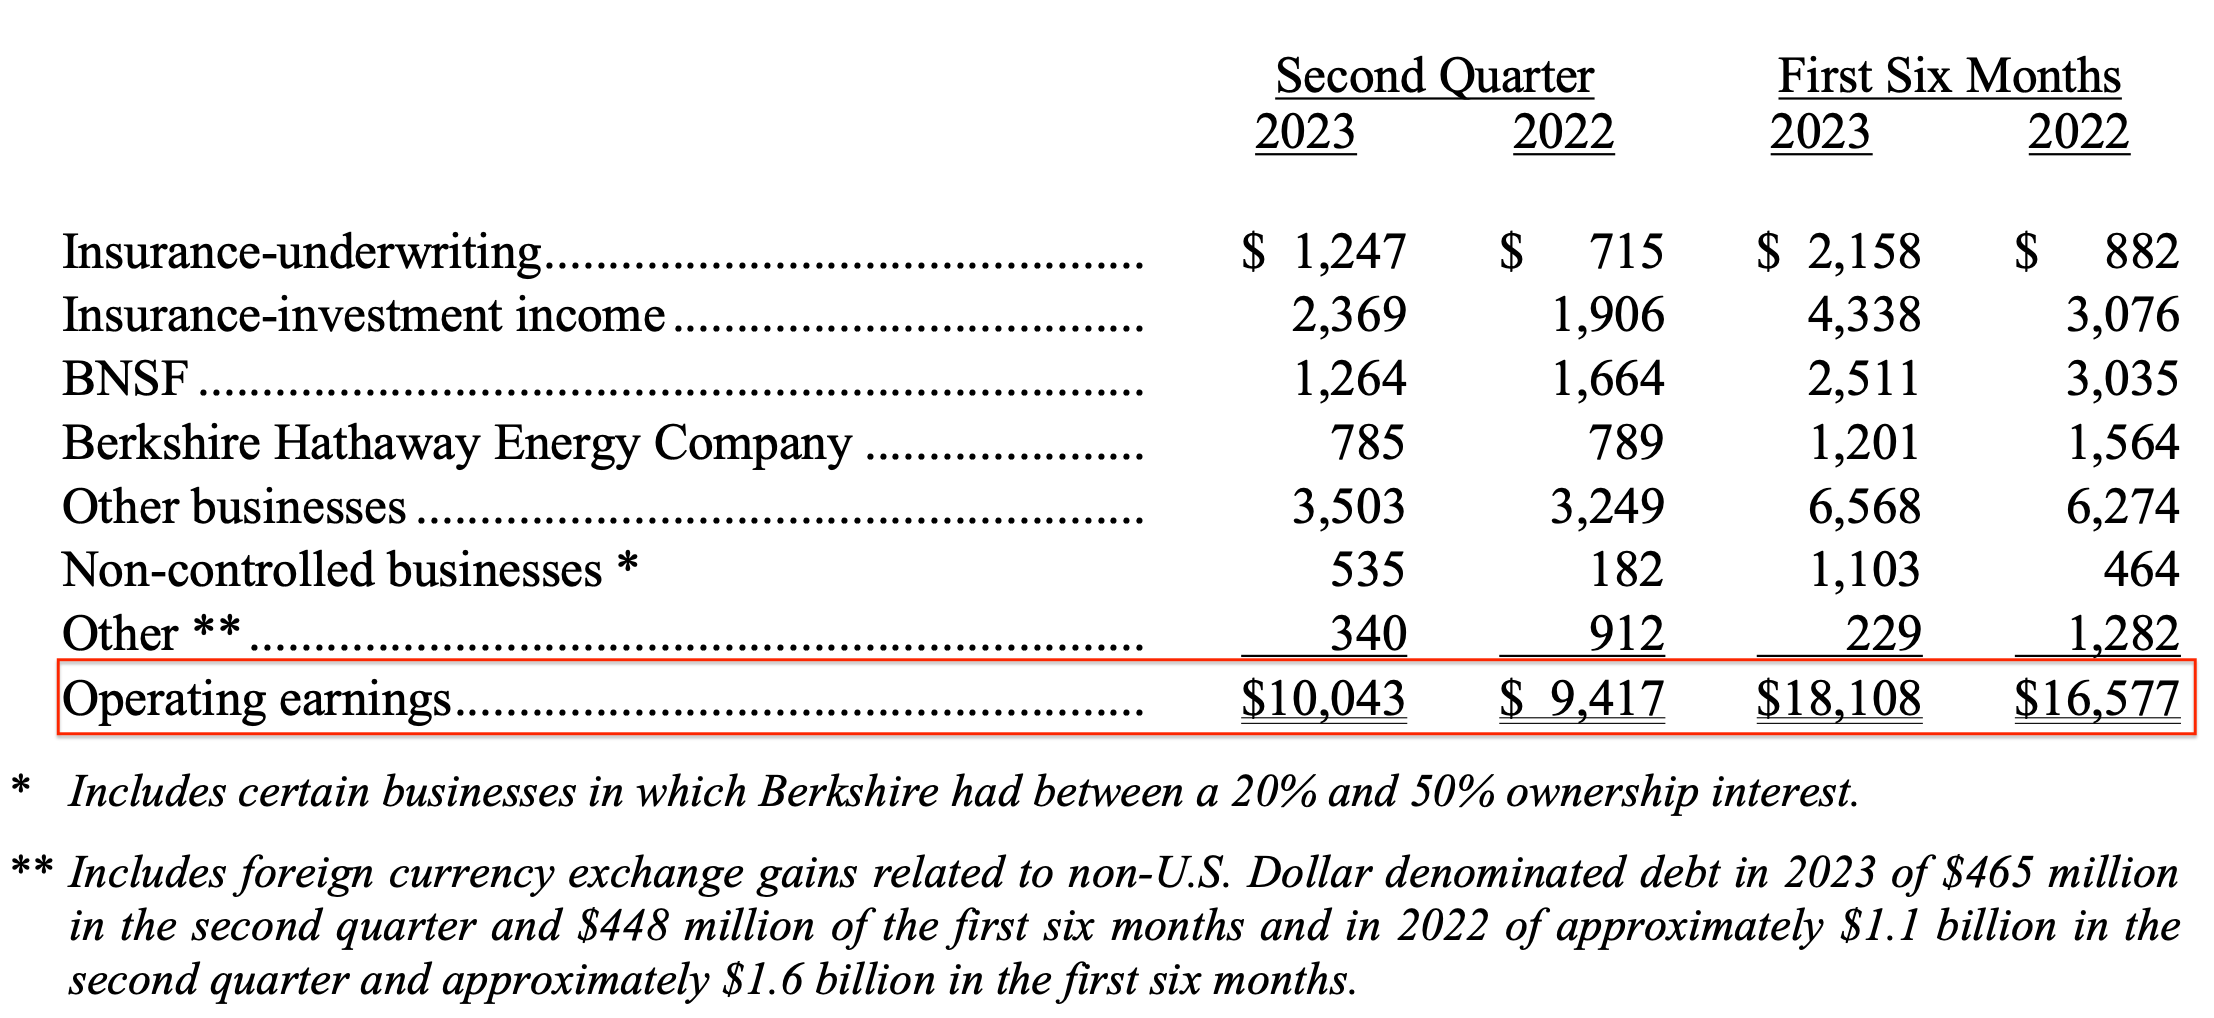
Operating earnings is still not a perfect measure of business performance. In his Twitter thread on second quarter results, Christopher Bloomstran mentioned the double asterisk shown above in the press release which discloses that operating earnings include foreign exchange gains related to Berkshire’s non-USD debt. If we strip the effects of forex gains, Berkshire’s adjusted operating earnings rose from $8.3 billion in the second quarter of 2022 to $9.6 billion in the second quarter of 2023.
It is useful to track Berkshire’s quarterly earnings at a high level over several years. By doing so, we can spot trends and track the overall trajectory of the business. We can also see how extreme volatility in investment gains and losses make quarterly net income next to useless from an analytical perspective. The following exhibit shows the reconciliation between operating and net earnings since the first quarter of 2020.
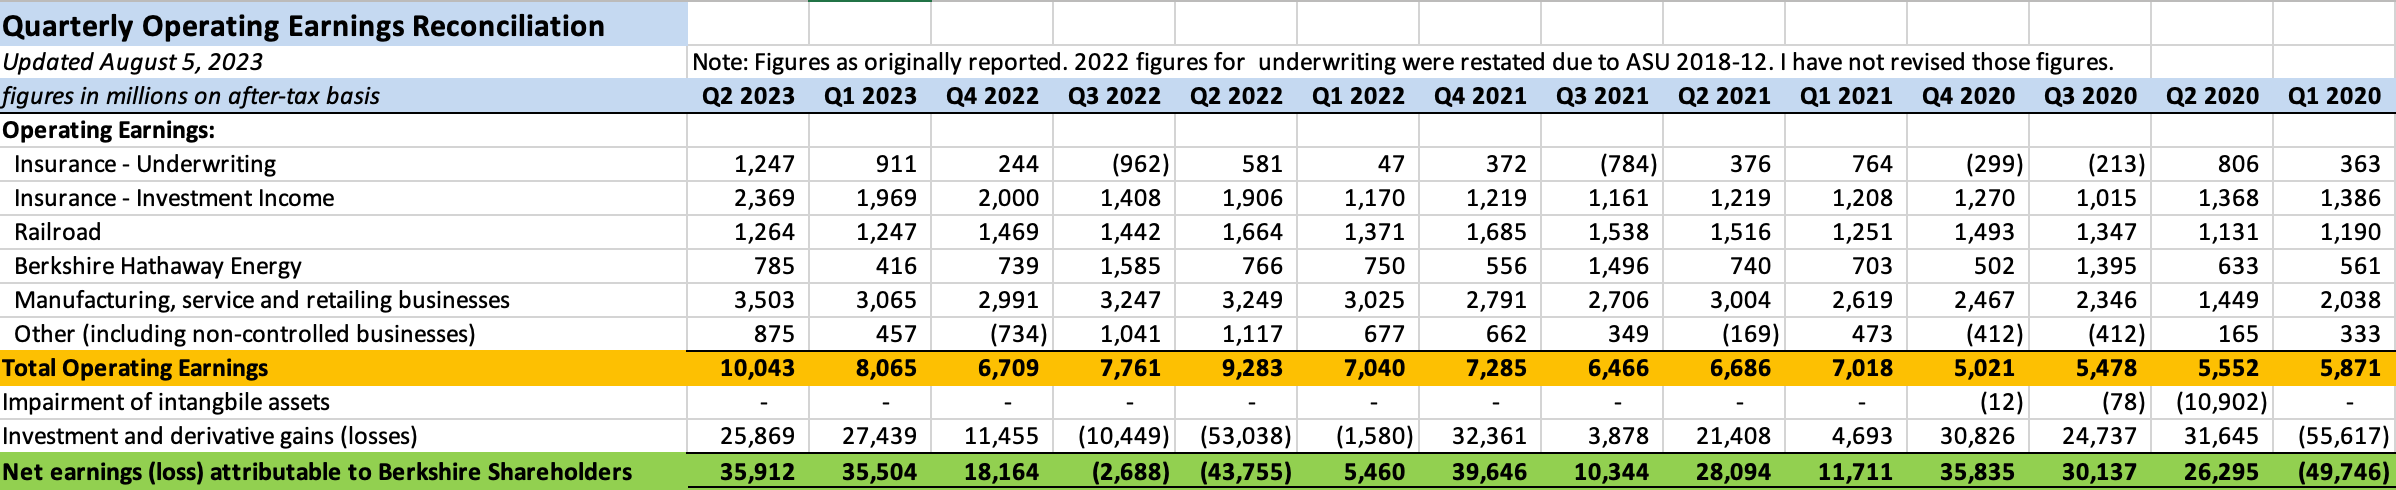
Although operating earnings are a better way to track underlying business performance at Berkshire on a quarterly basis, this does not mean that investment gains and losses should be totally ignored over longer periods of time. After all, Berkshire’s portfolio of equity securities was valued at $353.4 billion as of June 30, 2023 and, in the fullness of time, we should expect the equity securities to appreciate.
On an after-tax basis, investment and derivative gains totaled $93.6 billion over the fourteen quarters in the exhibit shown above which is an average of $6.7 billion per quarter. Fourteen quarters is an arbitrary number, but the point is that Berkshire’s true economic earnings are a combination of operating earnings and some average of investment gains over a reasonable period of time.
It is also useful to look at operating earnings on a trailing twelve month basis. There are seasonal elements in many of Berkshire’s subsidiaries so looking at operating earnings on a sequential basis can be misleading. On a trailing twelve month basis, operating income was $32.6 billion which represents a record high. The exhibit below shows trailing twelve month operating earnings over the past four and a half years.
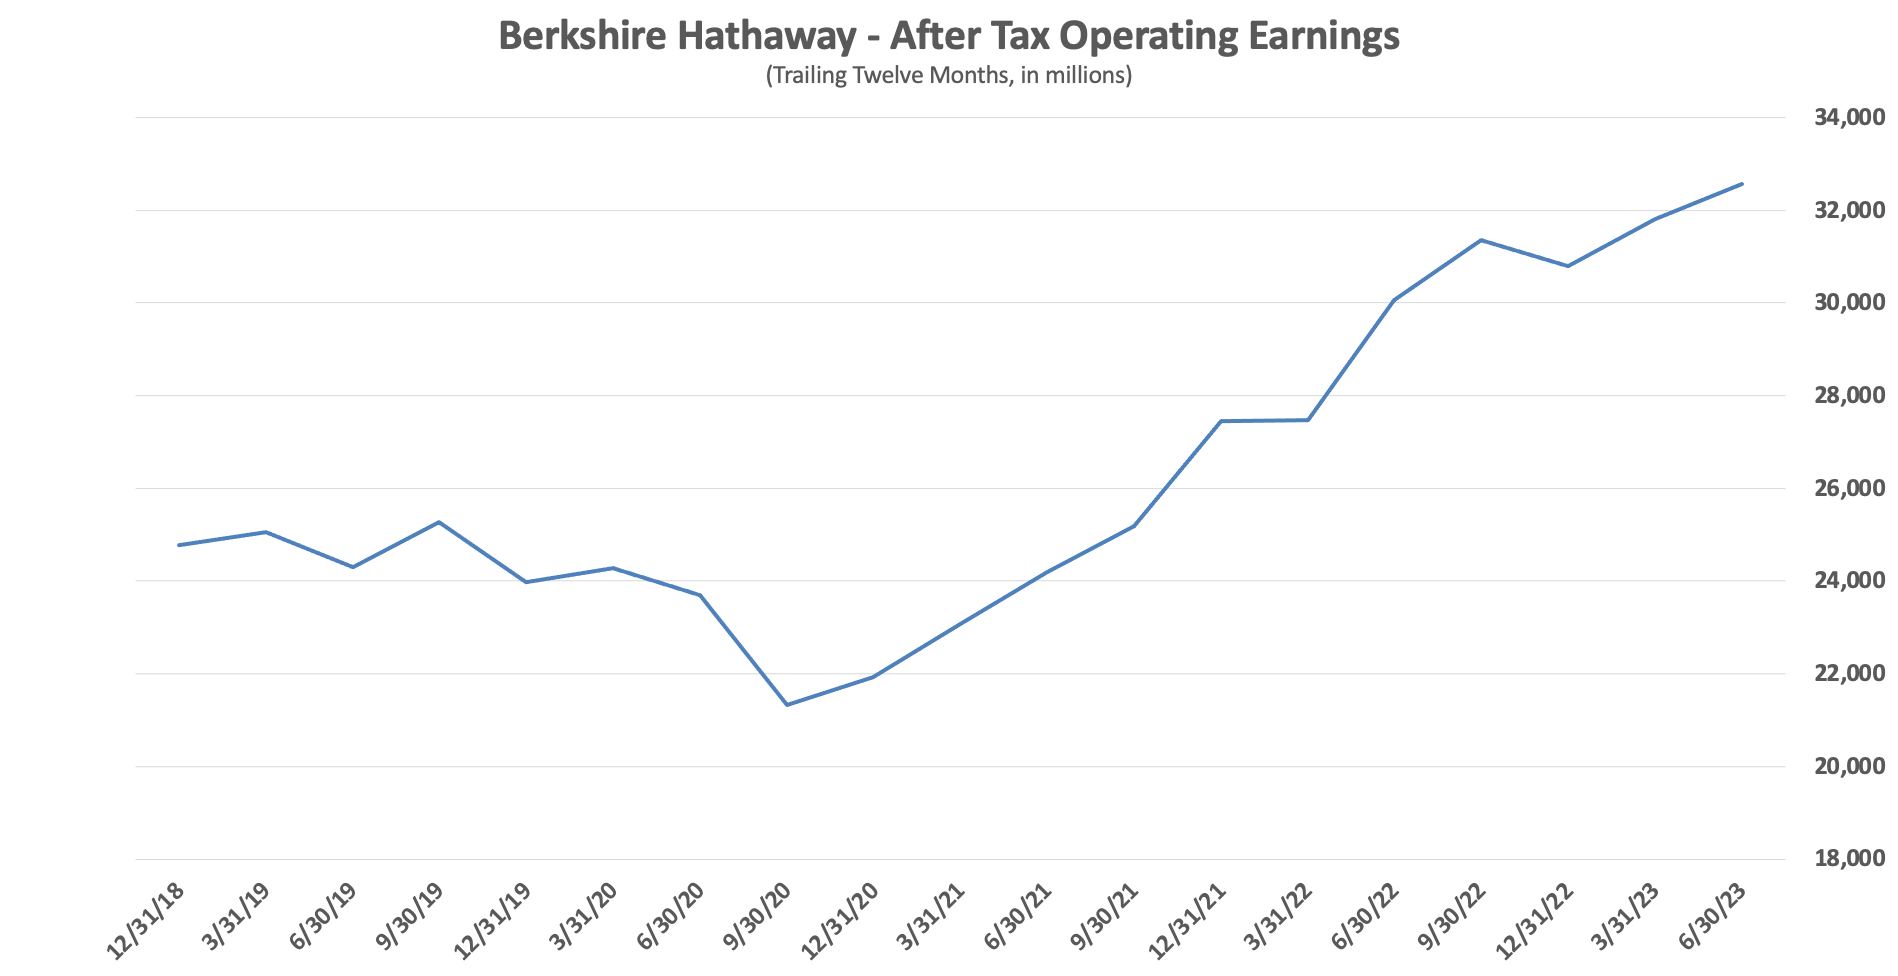
Each point in the graph shows the trailing twelve months, or four quarters, of after-tax operating earnings. For example, the data point for June 30, 2023 is the aggregation of operating earnings for Q3 2022, Q4 2022, Q1 2023, and Q2 2023.
During the annual meeting, Warren Buffett said that he expects the majority of Berkshire’s non-insurance businesses will report lower earnings in 2023. However, higher interest rates have benefited Berkshire’s holdings of treasury bills. As a result, barring major catastrophes, Mr. Buffett expects (but did not promise) that operating earnings will increase in 2023. So far, this prediction appears to be playing out.
This article goes into detail on a number of topics but it is not feasible to cover every area of this massive conglomerate in great depth in an article published the same weekend as quarterly results. Rather than attempting to summarize the entire company in a cursory way, I prefer to select a few areas to focus on each quarter which seem particularly interesting. This quarter, I have selected the following topics:
Several years ago, I dedicated four months of full time effort to produce an in-depth report on Berkshire which might still be useful as a historical reference but is otherwise outdated. The gold standard for current comprehensive coverage of Berkshire can be found in Christopher Bloomstran’s annual letters to his clients.
The section of this article discussing GEICO is for all readers but subsequent sections are limited to readers who have purchased a paid subscription. Paid subscribers can also submit comments and questions. Depending on the nature of the question, I might answer in the comments section or the question might become a topic for separate articles similar to those published in response to reader questions in June.
The about page has been updated to provide more information about the benefits of purchasing a paid subscription. The cost to subscribe is $10/month or $120/year.
Making Sense of GEICO’s Recent Results
After six quarters of underwriting losses, GEICO returned to profitability in the first quarter of 2023. As I wrote in my coverage of first quarter results, the return to profitability was an important milestone but the news was not all sunshine and roses because GEICO has been shedding customers. This trend has continued.
The good news is that GEICO has addressed the staggering losses experienced during 2022 by increasing premiums charged to customers. During the twelve months that ended on June 30, 2023, average premiums per auto policy increased by 16.3%. However, higher premiums and much lower advertising spending resulted in policies-in-force declining by 2.7 million, or 14.4%, over the twelve month period.
One of the hallmarks of Berkshire’s culture is that underwriters are told to reject business that they believe will result in underwriting losses. In other words, management wants to repel unprofitable business. At the same time, GEICO has gained market share over many decades. But market share gains are only pursued when they can be achieved while simultaneously earning underwriting profits.
The following exhibit shows GEICO’s results since the first quarter of 2020:

GEICO’s combined ratio was 94.7% for the second quarter, up slightly from 92.7% in the first quarter. The loss ratio was 84.3% for the second quarter while the expense ratio was 10.4%. Both figures are slightly higher than results for the first quarter. Still, a loss ratio in the mid 80s is far better than the levels that prevailed during 2022. The expense ratio remains historically low due to constrained advertising spending.
Results for the first six months of 2023 improved due to a reduction in loss estimates for prior accident years’ claims of $888 million compared to $207 million in 2022. This indicates that management was conservative in reserving for losses in 2022. Another way to look at the situation is to conclude that results reported in 2022 looked quite a bit worse than reality due to conservative loss estimates.
GEICO’s main rival is Progressive and I have written about the competition between the companies many times over the years. Progressive has been more aggressive than GEICO recently and has increased policies-in-force. At the end of June, Progressive had 29.6 million policies-in-force, up 11.6% over the past year.
While Progressive’s management has spoken about taking aggressive action to increase rates over the rest of 2023, they have clearly been more aggressive than GEICO when it comes to their market share goals. It is obvious that a significant number of the 2.7 million policies-in-force that GEICO shed over the past year ended up as customers of Progressive. Since auto insurance can be a “sticky” product, many of these policyholders might end up staying with Progressive in the long run.
Readers who are interested in this competitive situation might want to read the following recent articles about Progressive and GEICO as well as the full profile of Progressive published in December 2022. My first quarter coverage of GEICO also includes some quotes from Warren Buffett and Ajit Jain from the annual meeting.


My view of the situation is that GEICO’s management is taking the right approach to sacrifice market share if that is what is necessary to restore underwriting profitability. During periods of relatively flat premiums, automobile insurance can be a “sticky” product because consumers are more likely to compare prices when they see rate increases. If a bill is unchanged or rises only slightly, customers are likely to just pay it. However, during inflationary times, consumers are quite likely to search for competing quotes when staggering renewal invoices arrive.
GEICO’s brand is not impaired and the company’s low cost structure positions it well to recover market share from Progressive in the future when pricing eventually firms. Progressive is already under pressure from Wall Street to improve underwriting profitability. When pricing firms up, expect to see the Gecko make a strong return on television. I’ll be counting the little guy’s appearances during NFL broadcasts this fall.
If you find this article interesting, please click on the ❤️️ button and consider sharing it with your friends and colleagues.
Thanks for reading!
BNSF Results Deteriorate
In my coverage of first quarter results, I wrote that BNSF has been a strong performer for Berkshire Hathaway since it was acquired thirteen years ago. The railroad has returned over $50 billion in cash distributions to Berkshire over the years, far in excess of the cash paid for the acquisition, and Berkshire owns an enterprise that likely has a value in the neighborhood of Union Pacific’s $139 billion market cap.
Unfortunately, the railroad business is inherently cyclical because it is driven by the physical volume of goods that need to be shipped. While there is a certain degree of competition between BNSF and Union Pacific for market share, and while railroads compete with trucking in some cases, the overall health of the economy has a major influence on the results of a major Class 1 railroad.
Net earnings of BNSF declined 24% in the second quarter and 17.3% in the first six months of 2023 compared to 2022. Railroad operating revenues declined by 11.6% in the second quarter and 5.2% in the first six months of 2023 compared to 2022. This was driven by lower volume of 11.1% in the second quarter and 10.7% in the first half compared to 2022. Pricing power was constrained. Average revenue per car increased by 6.4% in the first six months of 2023 but decreased “slightly” in the second quarter.
BNSF’s operating ratio for the second quarter of 2023 was 68.2%, an increase of 5% from the second quarter of 2022. For the first half of 2023, the operating ratio was 68.3%, an increase of 4.4% compared to the first half of 2022.

Despite lower volumes shipped, compensation and benefits increased 13.6% due to a rising headcount, higher wages, and lower productivity. Fuel costs declined due to lower fuel prices, lower volume, and improved efficiency.
The decline in volume shipped was across the board with the most significant decline in consumer and agricultural products:

Consumer products declined primarily due to lower intermodal shipments due to lower west coast imports and the loss of an intermodal customer. Competition with trucking also increased with lower spot rates in the trucking market softening demand for intermodal containers that might otherwise be shipped via rail. One bright area was automotive volume. Management noted that volume declines in industrial products were due to lower demand for chemicals, plastics, and lumber as well as lower shipments of petroleum products due to refinery outages.
Readers who are interested in a longer-term review of the railroad industry in general as well as BNSF and Union Pacific in particular might want to read my profiles of the companies published last year:


I also wrote about the industry in March after the derailment in East Palestine, Ohio:

Union Pacific recently appointed Jim Vena to take over as Chief Executive Officer from Lance Fritz. Mr. Vena is known for his association with precision scheduled railroading (PSR) and worked for Hunter Harrison who pioneered the concept. I reviewed a biography of Hunter Harrison last year that goes into more detail on PSR:

BNSF has not officially adopted PSR but that does not mean that management is oblivious when it comes to improving operating performance. There is not much that BNSF can do about soft demand for shipping in general, but hopefully the operating ratio can be brought down over time in a manner consistent with a focus on safety necessary to avoid derailments and damaging relationships with labor unions.
HomeServices and Clayton Homes
The housing market is a very important component of the overall economy. Over the past two years, mortgage rates have skyrocketed. A personal example should illustrate the dramatic impact of higher mortgage rates on home affordability.
In July 2021, I purchased a home and financed two-thirds of the price with a thirty year fixed-rate mortgage at 2.75% through a credit union that I’ve had a relationship with for over a quarter century. Today, the rate offered on the same loan is 6.75%! My monthly mortgage payment would be 59% higher if I were to purchase the same property on identical terms today at the higher mortgage rate.
When interest rates rise this dramatically, one would expect housing prices to decline. This has not been the case for homes comparable to the one I purchased two years ago, nor has it been generally true nationwide. As mortgage rates have increased, homeowners who might otherwise choose to sell have opted to remain in place to avoid losing their ultra-low mortgage rate. Low inventory has suppressed transaction activity and most likely has acted to prop up prices, at least up to this point.
My purpose here is not to present an analysis of the overall housing market but to set the context for a discussion of Berkshire’s subsidiaries that are directly exposed to the housing market: Berkshire Hathaway HomeServices and Clayton Homes.
Berkshire Hathaway HomeServices
Berkshire Hathaway’s HomeServices unit is a subsidiary of Berkshire Hathaway Energy. According to Berkshire’s latest 10-K, HomeServices operates under 55 local brand names with approximately 45,000 real estate agents in 930 brokerage offices in 33 states as well as the District of Columbia.
The franchise network includes 300 franchisees and 1,500 brokerage offices with nearly 51,000 real estate agents. According to the HomeServices website, the entire network completed $154.7 billion of real estate sales in 2022.
After-tax earnings of the real estate brokerage business declined to $34 million in the second quarter of 2023, down from $84 million in the second quarter of 2022. For the first half of 2023, the brokerage business had breakeven results compared to $105 million of net income for the first half of 2022.
During the first half of 2023, brokerage service revenues and margins declined primarily due to a 26% reduction in closed brokerage transaction volumes as well as lower mortgage services revenues. Management cited the impact of rising interest rates on lower home sales volume and lower mortgage refinancing demand.
Clayton Homes
Berkshire Hathaway acquired Clayton Homes in 2003 when it primarily offered manufactured and modular housing. Over the past two decades, Clayton has grown significantly and now offers site-built homes as well as financing products funded with low-cost debt that is guaranteed by Berkshire at the parent company level.
In 2022, Clayton delivered 53,000 manufactured and modular homes and 11,750 site-built homes. At yearend 2022, the backlog of modular and manufactured homes was $256 million which was down 82% from yearend 2021. Clayton has been growing its site-built home operations through nine acquisitions since 2015 and now controls approximately 70,000 homesites and had a site-built home order backlog of $1.4 billion as of December 2022.
Berkshire’s 2022 10-K noted that low interest rates helped Clayton in recent years but rising rates in 2022 contributed to slowing demand. This has continued in the first half of 2023. Clayton’s revenues declined 16.3% to $2.9 billion in the second quarter and 13.8% to $5.4 billion in the first six months of 2023 compared to 2022.
New home unit sales declined 19.5% in the first half due to lower sales of both factory built and site built homes. Management expects unit sales in the second half of 2023 to be below 2022 levels. Pre-tax earnings declined $72 million, or 11.5%, in the second quarter and $150 million, or 13.5% in the first six months of 2023 compared to 2022.
Berkshire Hathaway Finance Corporation (BHFC) issues senior notes that are guaranteed by Berkshire Hathaway at the parent company level. The borrowings are primarily used to fund loans originated or acquired by Clayton Homes. As of June 30, 2023, approximately $18 billion of BHFC senior notes were outstanding. The largest component of BHFC funding, at $14.5 billion, are U.S. dollar denominated notes due between 2027 and 2052 with a weighted average interest rate of 3.6%.
Berkshire’s guarantee effectively provides cheap funding for Clayton to extend credit to home buyers. Historically, Clayton has experienced very low credit losses. As of June 30, 2023, 97% of Clayton’s loans were considered current. The following exhibit shows how minimal non-performing loans have been based on year of origination:

Although Berkshire Hathaway HomeServices and Clayton Homes are not, either individually or in aggregate, major components of Berkshire Hathaway, they are worth following as a proxy for trends in the overall United States housing market.
When we hear pundits on television opining on the state of the macroeconomy, it is usually safe to turn down the volume given the difficulty of making good economic forecasts. Even the Federal Reserve, with its army of PhD economists, has trouble making macroeconomic forecasts. In contrast, Warren Buffett has at his disposal voluminous data pertaining to important sectors of the economy including housing.
Apple’s Dominance of the Investment Portfolio
I have often been asked about the growing importance of Apple in Berkshire’s investment portfolio. Berkshire’s second quarter 13-F report will not be filed for several more days but my inference from reading Note 5 of the 10-Q is that Berkshire did not reduce its Apple position during the quarter.
As of June 30, 2023, Berkshire owned $177.6 billion of Apple stock according to Note 5 of the 10-Q. This is just over half of the equity securities on Berkshire’s balance sheet as of June 30, excluding publicly traded equity method investments (KraftHeinz and Occidental Petroleum). Given that the cost basis of the Apple position is ~ $31.1 billion, Berkshire had an unrealized capital gain of approximately $146.5 billion as of June 30, 2023. Net of the deferred tax liability which I’ll ballpark at 20%, Apple’s contribution to Berkshire’s equity was ~$148 billion as of June 30, 2023.
With Berkshire’s shareholders’ equity at $539.9 billion as of June 30, 2023, the Apple position accounts for a massive 27.4% of the total. At the 2023 annual meeting, Warren Buffett made it clear that he does not view Apple as half of Berkshire’s portfolio of common stocks but more akin to a wholly owned subsidiary like BNSF or BHE. At this point, it is likely that Apple’s contribution to Berkshire’s intrinsic value is comparable or even higher than the contribution of BNSF.
Here it is appropriate to make a distinction between Berkshire’s shareholders’ equity (book value) of $539.9 billion and its market value and intrinsic value. Berkshire’s market capitalization as of August 4, 2023 was ~$770 billion, approximately 143% of shareholders’ equity. The Apple position accounts for less than 20% of Berkshire’s market capitalization which is a more appropriate way to look at the situation.
Warren Buffett’s decision to take a big swing on Apple has been a home run. Like many Berkshire shareholders, I have concerns about how dominant Apple has become both as a percentage of the investment portfolio and as a percentage of Berkshire’s market value. Apple’s market capitalization has recently declined below the $3 trillion milestone but there is still a great deal of optimism baked into the cake with a price-to-earnings ratio in excess of 30.
In my opinion, Berkshire shareholders who are concerned about Apple have a simple remedy. We are free to assign a lower value to Apple based on a more conservative assessment of its intrinsic value and to adjust Berkshire’s value accordingly. When doing so, we should be sure to account for the reduction of the deferred tax liability that would go along with a decline in Apple’s price.
I have no reason to believe that Mr. Buffett will reduce Berkshire’s ownership of Apple anytime soon. He appears to view it as a quasi-permanent holding based on his comments at the annual meeting. It seems best to take a philosophical view of the situation. If Apple’s business results take a turn for the worse and/or Mr. Market assigns a lower valuation to the stock, Berkshire’s investment might morph into a double or a triple compared to its current status as a grand slam home run.
I’ve been asked whether Berkshire shareholders might want to consider shorting Apple stock to reduce net exposure. In my opinion, this is a crazy idea. For one thing, we do not have any real-time insight into Berkshire’s current ownership of Apple. The 13-F report comes out four times per year almost six weeks after the end of a quarter making our insight into the current position size stale at best. Furthermore, investing in Berkshire involves a vote of confidence in Warren Buffett’s judgment. It seems unwise to try to partially overrule his judgment. At least it seems unwise to me.
Repurchase Activity
Berkshire Hathaway ended the second quarter with $141.9 billion of cash and treasury bills excluding cash in the railroad and utility segment. Repurchase activity during the quarter was relatively muted at just over $1.3 billion.

Somewhat oddly, the vast majority of buyback activity took place in June after the stock price had rallied compared to levels that prevailed earlier in the quarter.
I have maintained a spreadsheet containing all of Berkshire’s repurchases since the buyback program was first introduced in September 2011. The exhibit below only shows the past year of repurchase detail although the grand totals are for the entire history of the repurchase program. To validate my figures, I cross-check them with the details provided in Note 19 of the 10-Q (see figures highlighted in red boxes):

On a trailing twelve month basis, Berkshire has allocated $9.6 billion toward repurchases at “trailing” price-to-book ratios between 1.34x and 1.49x. The “trailing” price-to-book ratio takes the average price paid per Class A equivalent and divides it by the last reported book value per share. In practice, Mr. Buffett has knowledge of book value during the course of a quarter, so this metric is only a crude approximation of the price he is willing to pay for Berkshire shares. Furthermore, we know that he has de-emphasized the utility of Berkshire’s book value as a proxy for intrinsic value.
Berkshire continues to generate significant cash flow and the cash balance of $141.9 billion seems comfortably above the $30 billion minimum cash position at which point repurchase activity would cease. However, we should keep in mind that Berkshire has continued to have a very low allocation to fixed maturity investments (bonds) relative to cash and treasury bills. Readers might want to refer to my recent article on Berkshire’s fixed maturity portfolio for more details:

The yield curve is currently inverted, meaning that short term treasury bills offer a greater rate of interest compared to medium and longer term treasury notes and bonds. Warren Buffett seems content to roll over treasury bills rather than take advantage of improved yields on longer term treasuries. Therefore, I think it is prudent to view at least part of Berkshire’s cash as a substitute for fixed income and not necessarily available for repurchases or other purposes.
This view gains some credence when we look at the sum of Berkshire’s cash and fixed maturity investments as a percentage of float over the past decade. When viewed in this light, the magnitude of Berkshire’s $141.9 billion of cash and treasury bills does not seem quite as large.
Conclusion
While this article has covered only a small subset of Berkshire Hathaway’s second quarter results, it is already quite long and I wanted to send it to subscribers by the end of the weekend.
In my opinion, Berkshire is performing well overall although weakness in sectors of the economy have shown up in areas such as BNSF, the housing related subsidiaries, as well as parts of the Manufacturing, Service, and Retailing group.
It will be interesting to see how GEICO’s performance evolves over the remainder of the year, especially how management balances the need to maintain underwriting profitability with the desire to recover market share.
I have not discussed the reinsurance business in this article but I continue to watch the NOAA website carefully given Ajit Jain’s comment at the annual meeting about a potential $15 billion loss if a bad hurricane hits Florida this season.
This screenshot taken today is what we want to see through the end of November!

If readers have questions or comments about the quarterly report, please feel free to comment below and I will do my best to respond. This is also a good opportunity to interact with other readers who are familiar with Berkshire Hathaway and might want to discuss or debate various points. Questions might also prompt ideas for additional articles similar to the questions readers asked a couple of months ago.
I hope this discussion of second quarter results has been useful and, if you’ve made it all the way to the end, thanks for reading this article!
Copyright, Disclosures, and Privacy Information
Nothing in this article constitutes investment advice and all content is subject to the copyright and disclaimer policy of The Rational Walk LLC.
Your privacy is taken very seriously. No email addresses or any other subscriber information is ever sold or provided to third parties. If you choose to unsubscribe at any time, you will no longer receive any further communications of any kind.
The Rational Walk is a participant in the Amazon Services LLC Associates Program, an affiliate advertising program designed to provide a means for sites to earn advertising fees by advertising and linking to Amazon.com.
Long Berkshire Hathaway.
Another first-rate, insightful analysis, Ravi! You dug into the detail usefully.